Sunday, 05-07-26


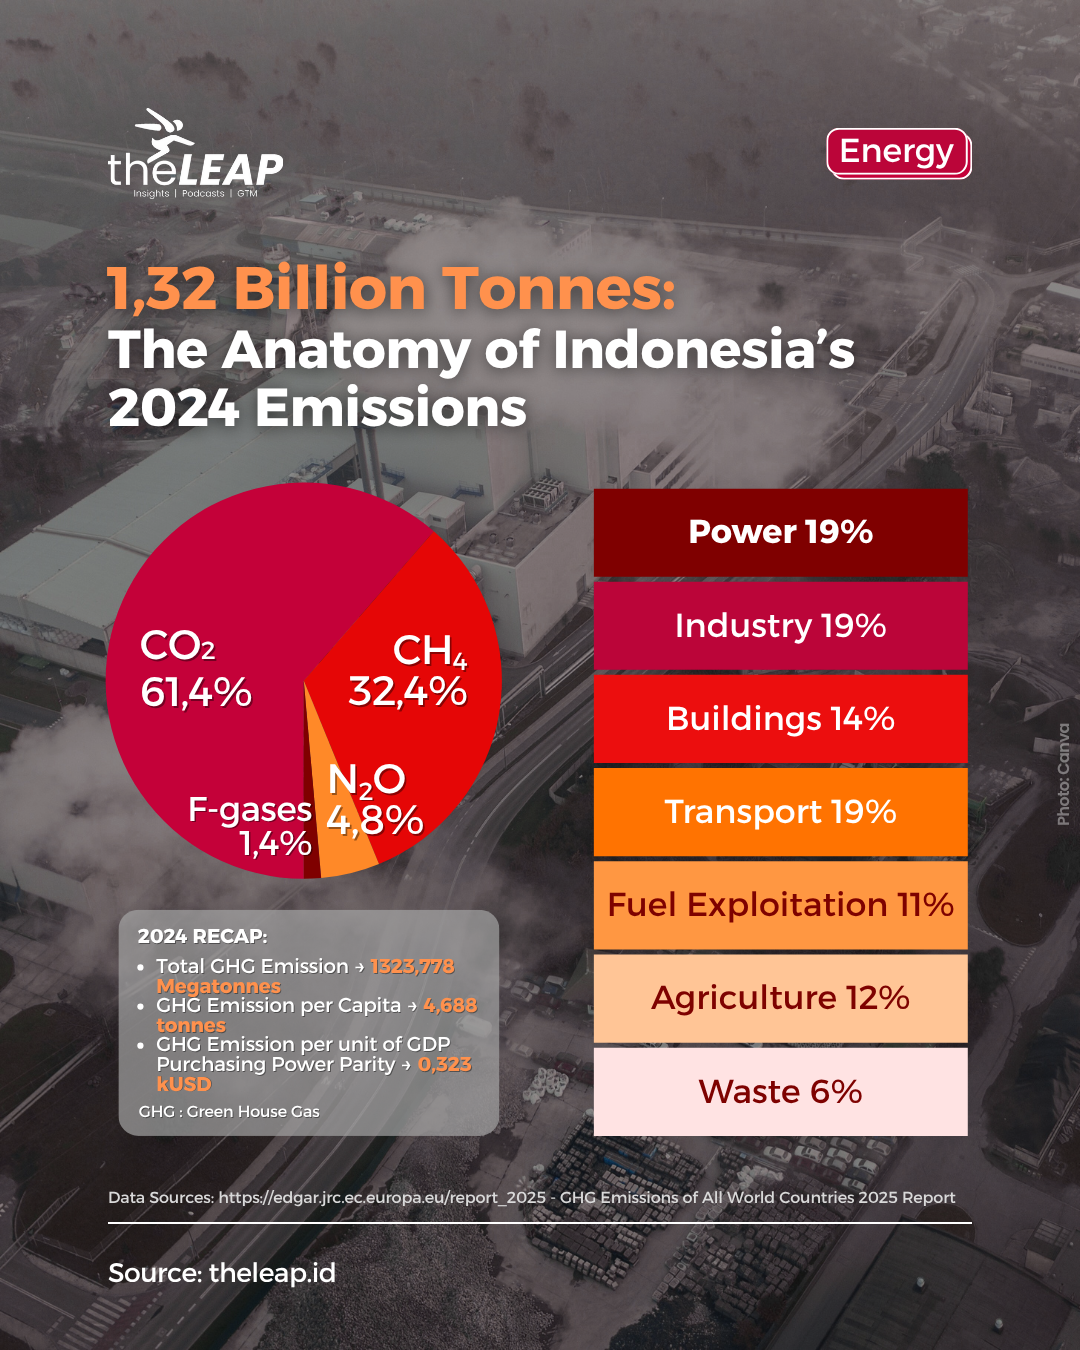
Indonesia’s greenhouse-gas (GHG) emissions in 2024 reached an estimated 1,323.78 million tonnes (Mt) of CO₂-equivalent – a snapshot that underscores the scale and complexity of the country’s climate challenge. The data come from the Joint Research Centre (JRC) Emissions Database for Global Atmospheric Research (EDGAR).
What stands out is not just the magnitude, but the composition: roughly 61.4% of those emissions were CO₂, 32.4% were methane (CH₄), 4.8% were nitrous oxide (N₂O) and 1.4% were fluorinated gases (F-gases). This makes clear that while CO₂ remains the dominant greenhouse-gas by mass, methane is a major player.
Gas-type Breakdown: Why Methane Matters
CO₂ has long been the primary focus of climate mitigation efforts in Indonesia, and for good reason, given its large share. But a methane share of over 30% signals that a significant portion of the problem lies beyond just fossil-fuel combustion. Methane sources include rice paddies and livestock, landfills, and fugitive emissions from oil & gas. Targeting methane offers the possibility of faster warming-impact reductions, given its higher global-warming potential per unit mass and shorter atmospheric lifetime.
Sectoral Drivers: Where the Tonnes Come From
Although detailed sector-percentages are best gleaned directly from the EDGAR dataset, the broadly visible drivers are clear:
- The energy/power generation sector (electricity and heat) is one of the largest contributors, driven by fossil-fuel (especially coal) combustion.
- The industry sector, manufacturing, metal and chemical processes, also contributes heavily.
- Transport (road, aviation, shipping) remains a sizeable emitter.
- Fuel exploitation (oil & gas extraction, flaring and leaks) contributes not just CO₂ but significant methane.
- Agriculture (rice cultivation, livestock) and waste-management (landfills, waste treatment) are important methane and N₂O sources.
Putting the gas-type and sectoral breakdown together gives a more actionable picture: CO₂-dominated sectors (energy, industry, transport) plus methane-heavy sectors (agriculture, waste, fuel exploitation) stand out as dual tracks for mitigation.
Why the 2024 Snapshot is Significant
Globally, GHG emissions excluding land-use change (LULUCF) reached approximately 53.0 Gt CO₂-eq in 2023, according to EDGAR. Indonesia’s 1.32 Gt in 2024 thus accounts for around 2.5% of the global total, for one emerging economy, that is a non-trivial share.
Historically, the country has seen substantial growth in emissions: past data show large increases compared with 1990 and 2005 baselines. That escalation reflects rapid industrialisation, growing energy demand, expansion of fossil-fuel infrastructure and agriculture intensification.
The breakdown of gas and sectors tells us something else: the challenge is multifaceted. It is not just “stop coal” (though that is essential), but also “address methane” and “clean agriculture/waste”, a broader mitigation portfolio.
What the Data Imply for Policy, Business & Investment
Diversified mitigation strategy needed. Indonesia’s emissions profile suggests that targeting only CO₂ will leave a large chunk of the issue unaddressed. Policymakers and business strategists must bring in methane reduction (rice/livestock practices, landfill capture, oil & gas leak reduction) alongside decarbonisation of power and industry.
Investment opportunities and risks. On the opportunity side: renewables, grid modernisation, waste‐to‐energy and methane capture technologies present growth domains. On the risk side: fossil-fuel infrastructure (especially new coal or gas plants) faces potential early‐stranding if mitigation efforts accelerate. Companies aligned exclusively with high-carbon sectors may face regulatory, reputational or financing headwinds.
Communication and stakeholder alignment. For businesses and government alike, an infographic or visual breakdown of this snapshot helps translate complex data into a clear message: “Here is where our emissions are coming from, so here is where our action must focus.” That clarity supports internal strategy, investor messaging and public policy communication.
Baseline for tracking progress. The 2024 figure provides a benchmark. Subsequent years can be compared to see whether methane’s share falls, whether coal-based power declines, whether per-capita intensity improves. Metrics like tonnes per capita or emissions per GDP are critical here. For example, data show Indonesia’s per-capita GHG emissions (excluding LULUCF) remain lower than many advanced economies, but growth in total means urgency in decoupling remains high.
The “1.32 billion tonnes: the anatomy of Indonesia’s 2024 emissions” snapshot offers a compelling entry point into the country’s climate story. It is not only the volume that matters, it’s the composition and origin of the emissions that provide the roadmap for action. For businesses, investors and policymakers, the data highlight two parallel tracks: decarbonise the big CO₂ sectors and tackle the sizeable methane component. An infographic built around this angle can turn dense data into a clear narrative for social-media audiences, LinkedIn professionals and corporate stakeholders alike.
Read More